IBS Academy Free Education

Sort By:
WHAT ARE CHART PATTERNS?

By IBS ACADEMY

Introduction

Looking at nature, we often see patterns like the rings inside a tree trunk or the way ripples spread across water when you drop a pebble. In the market, we see similar patterns, but they appear on charts that track the prices of stocks over time. These are called chart patterns. They help people who buy and sell currencies make decisions by giving them a hint about what might happen next with the prices.

What Are Chart Patterns?

Chart patterns are shapes that show up on the charts where prices are plotted. They form because of the way people buy and sell stocks. When lots of people want to buy a currency pair, the price goes up. When many want to sell, the price goes down. These ups and downs can make shapes or patterns.

Traders look at these shapes to try and guess where the price will go next. It’s a bit like predicting the weather by looking at the clouds. If you know what different cloud formations mean, you can guess if it’s going to rain or be sunny. In trading, if you know what different chart patterns mean, you can make a better guess about whether the price of a currency pair will go up or down.

There are many different continuation and reversal patterns to learn to trade the market successfully. you can download the pdf file from the link below.

BEARISH AND BULLISH MEGAPHONE PATTERN

By IBS ACADEMY

bullish megaphone pattern

Many forex chart patterns frequently occur, like the triangle and wedges. Some are not very common, like the megaphone.

Yes, the pattern gets its name because it resembles a megaphone.

Although the pattern rarely occurs, you can easily identify it.

In this guide, we’ll talk about a megaphone pattern and how you can trade it.

Megaphone pattern definition

In 1932, Richard W. Schabacker discussed the megaphone pattern in his book, “Technical Analysis and Stock Market Profits.”

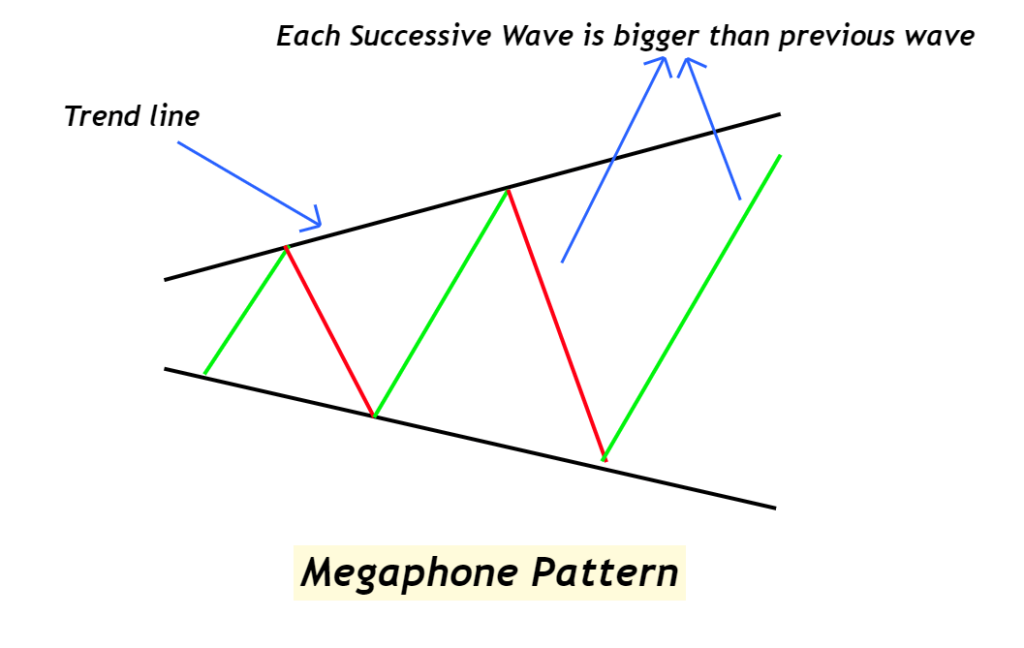
A megaphone is a chart pattern depicting a widening channel of high and low levels, forming a megaphone-like structure. It is also known as a broadening formation.

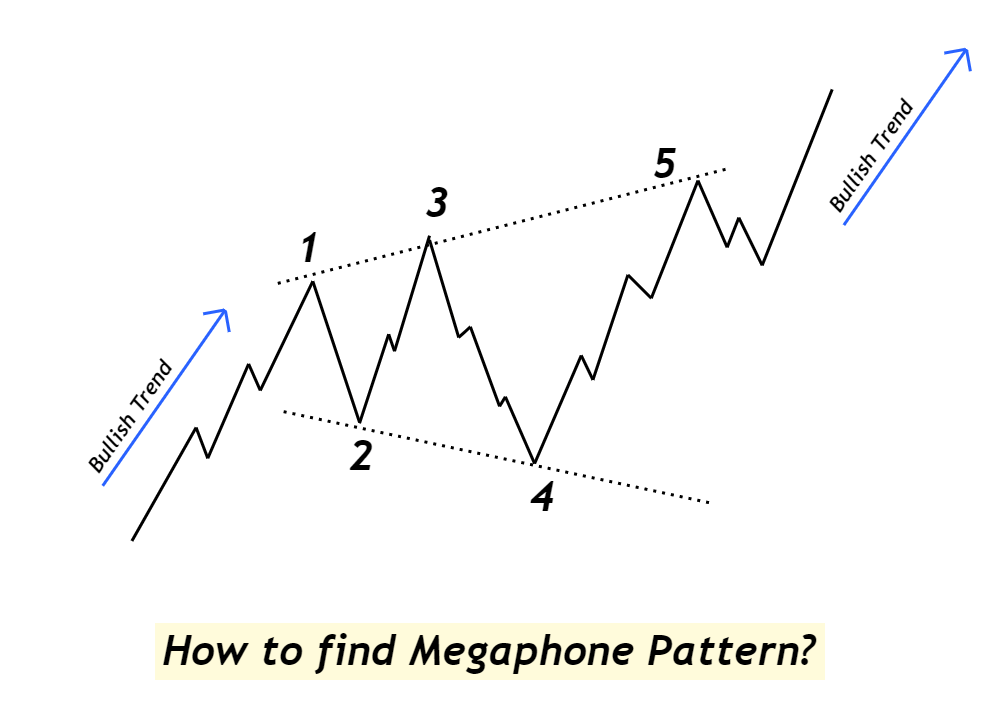
The pattern consists of two higher highs, two lower lows, and five different swings. The good thing about the megaphone pattern is you can use it as a continuous and reversal pattern.

You can create the channel by drawing upper and lower trendlines.
megaphone pattern

Types

There are two types of megaphones; bullish and bearish.
bullish megaphone pattern

Bullish megaphone

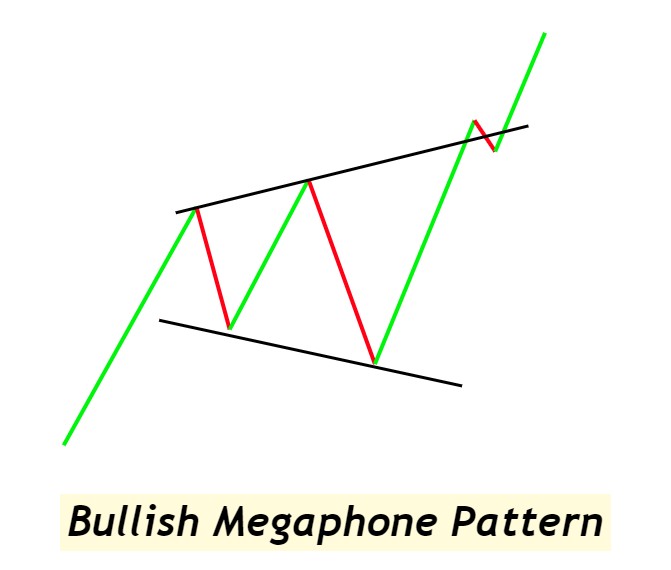
The bullish megaphone appears when the price goes above the channel. Once the price breaks the upper level, you can take the trade at the fifth swing.
bearish megaphone pattern


Bearish megaphone

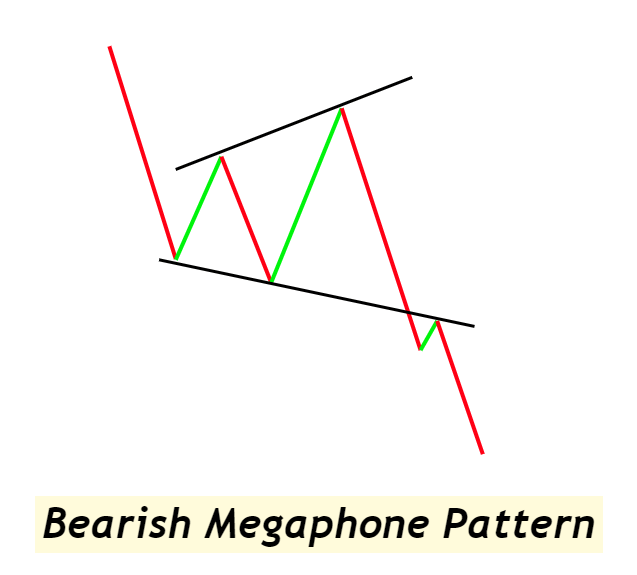
The bearish megaphone occurs when the price goes below the channel. Here, the price breaks the lower level, presenting a short entry point.


How to find a megaphone pattern in trading?

A megaphone pattern occurs during periods of high volatility. Usually, you don’t get a clear indication during volatility. With a megaphone, you have higher and lower highs at the same, identifying market uncertainty.

As mentioned earlier, the megaphone has five swings. Each swing is bigger than the previous one and represents lower lows and higher highs. You can also have minor swings between the five major swings.

As the pattern forms during high volatility, each swing is bigger than the previous one. The fifth one is the largest, and this is where you enter the trade.

On the chart below, you can see a bullish megaphone. The price creates five swings with smaller swings in between. The fifth wave is the largest, and once the price breaks the channel, it presents a long entry point.
market structure

What does the megaphone pattern tell traders?

This pattern appears during high volatility, representing the battle between the bulls and the bears.

Buyers are entering the market and want to buy even a high price. On the other hand, sellers are looking to make a profit from the increased volatility.

It creates a tussle between the buyers and sellers; hence, we get peaks and troughs. When you connect these highs and lows, you get a megaphone chart pattern.

Features Pattern Characteristic
Type of Trend Trend Continuation
Winning ratio +70%

Megaphone pattern information table

How to trade a megaphone pattern?

To trade it, first, you need to know that megaphone comprises Fibonacci ratios. Each swing in the pattern has a fib ratio and a 1.27 to 1.62 extension ratio.

Megaphone works as continuous and reversal patterns. So, you can have two trading opportunities. You just need to place the trades after the fifth swing because the price will reverse after the fifth swing.

It may sound confusing, so let’s break it down.

Breakout strategy

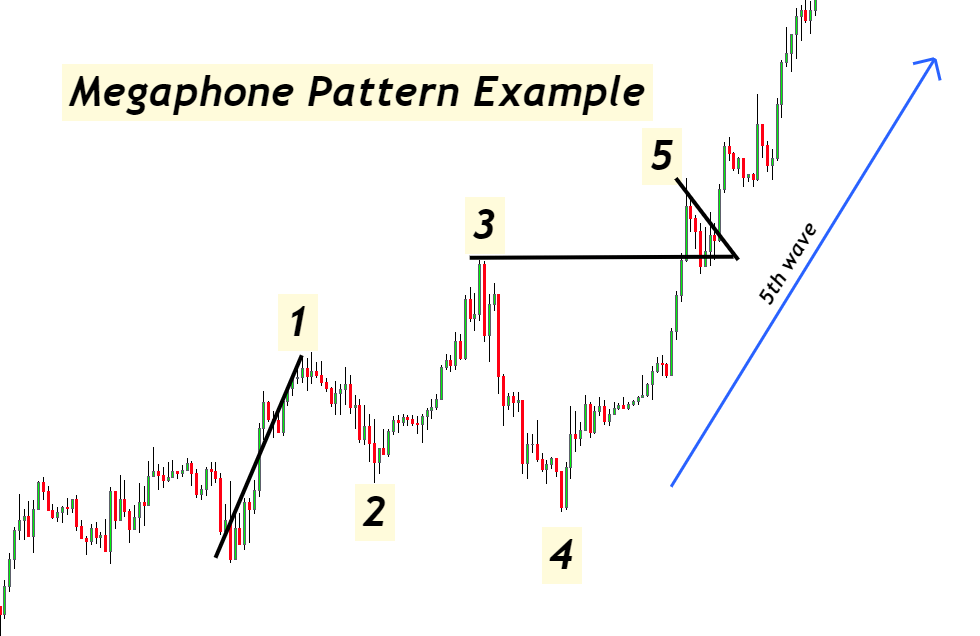
To trade the megaphone breakout as a continuation, you need to take the trade in the direction of the breakout.

You can enter a long position when the price closes outside the pattern.
trade example

On the chart above, you can see an uptrend breakout megaphone. The price created five swings, retraced at the fifth swing, and then we got our long entry point.

Conversely, you can take short positions after the fifth swing in a downtrend breakout.

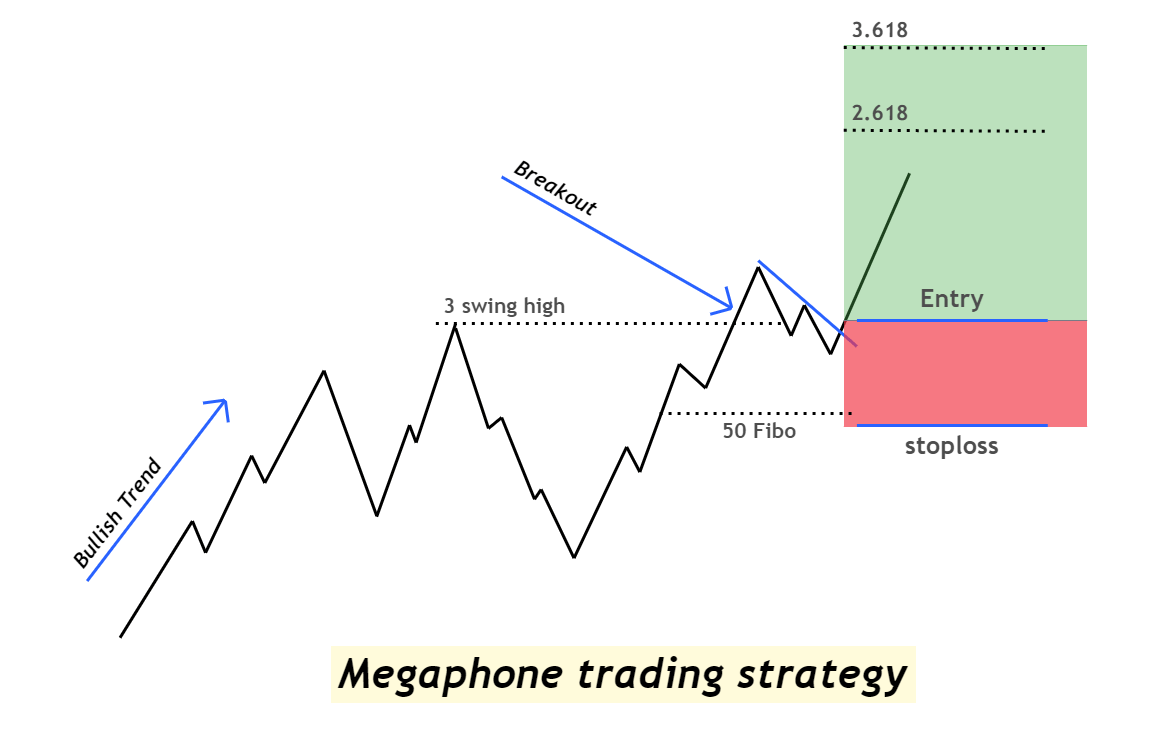
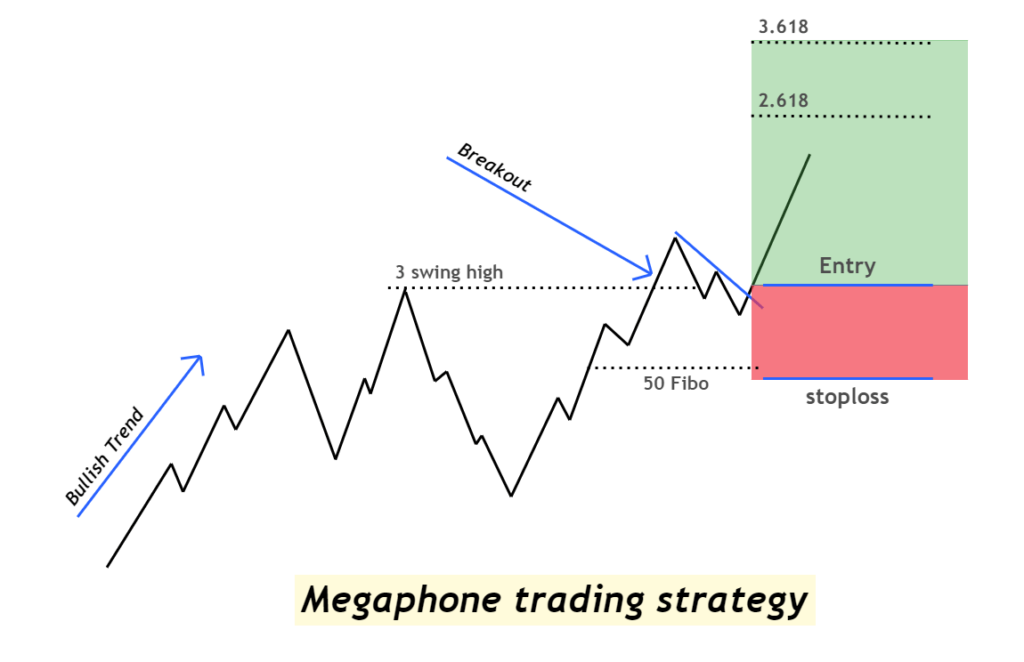
You can set the take-profit using the Fibonacci ratios. When the fifth swing breaks the 3rd swing level, it creates a small range, and you can set TP at 2.618 or 3.618 from that range.

For stop-loss, you can place it 50% from the range.

Also Checkout the SUPER LOTTERY $100,000 for NordFX Broker Clients! 100 Prizes and a super prize of $20,000. It is very easy to participate. Click here to Learn More
megaphone pattern trading strategy

Let’s apply the megaphone strategy. On the chart above, you can see a breakout pattern. After reaching the fifth swing, the price started to retrace but continued with the bullish move. At this point, we entered the trade.

We set the take-profit using a Fib ratio of 2.618 and 3.618. We place two TPs here, but if you want to exit the position earlier, you can set it at 2.618.

For SL, we used the 50% Fib level of the range between the 3rd and 5th swing.

How to trade Megaphone Pattern?

The bottom line

Although it doesn’t frequently occur on the chart, the megaphone pattern is highly effective. It identifies the price continuation and reversal so you can trade it both ways.

You need to know that the longer the timeframe, the more effective pattern will be. Also, you need to identify the pattern properly.

BULLISH RECTANGLE PATTERN

By IBS ACADEMY

bullish rectangle pattern

Definition

A bullish rectangle pattern is a chart pattern in which price moves sideways or in range on a candlestick chart with a bullish breakout.

This chart pattern acts as both a trend continuation and trend reversal pattern. However, retail traders mostly use it as a continuation chart pattern because of the high winning ratio.

In this post, you’ll learn about both types of bullish rectangle patterns, along with a simple day trading strategy.

bullish rectangle pattern

How to identify a rectangle chart pattern?

The rectangle chart pattern represents the market condition. For example, during this chart pattern, the price moves sideways. The market moves within a price range with time, forming a rectangle-like shape on the chart.

To find the rectangle pattern accurately on the chart, you should follow the following steps

  • The price pattern should form two highs and two lows.
  • There much be two price touches on the resistance zone, and two price touches on the support zone.

Like in the image below, the price is moving sideways with respect to time.

highs and lows of rectangle pattern

Breakout with a bullish candlestick

is the most critical step you should check carefully. Because the market is full of false breakouts.

A good breakout happens with a big bullish candlestick. The bullish candlestick should have a high body-to-wick ratio. Because it represents a valid breakout. On the other hand, if a doji candlestick or small breakout candlestick form, you should always wait for breakout confirmation with a big candlestick. Because small candlestick has low momentum and primary key level’s breakout always happens with a high momentum candlestick.

breakout with big bullish candlestick

Types of the bullish rectangle pattern

There are two types of bullish rectangle patterns based on the market trend.

  1. Trend reversal rectangle pattern
  2. Trend continuation rectangle pattern

In the case of a trend reversal, the bullish rectangle pattern forms after the bearish market. When the sellers keep pushing down the market, bullish rectangle pattern forms, and then a bullish trend starts.

It is the most aggressive type of pattern because many false breakouts and patterns form, leading to a loss in trading. However, you can also use this forecast for analysis or confluence purposes in trading.

trend reversal bullish rectangle pattern

In case of trend continuation, the bullish rectangle pattern forms during the bullish trend. It is a high probability pattern because it creates the direction of the bullish trend. Retail traders widely use this pattern to trade the markets.

I will also recommend continuing the rectangle pattern over the trend reversal pattern to get a high winning ratio.

trend continuation bullish rectangle pattern

What does the bullish rectangle pattern tell traders in trading?

The rectangle chart pattern is a symbol of indecision in the market. It means the big traders and institutions are deciding their future direction either they will start a bullish trend or will start a bearish trend. It depends on the breakout of the rectangle pattern on the price chart.

When the price moves sideways, the potential of buyers is almost equal to the power of sellers. That’s why prices move in a range.

However, when a bullish breakout of the rectangle pattern’s resistance zone happens, a bullish rectangle pattern form.

The bullish rectangle pattern completes only after the breakout of the resistance zone in the bullish direction. Before breakout, the price can also start a bearish trend because the price will be in the decisive phase. Only breakout confirms the future direction of the market.

Day trading strategy for rectangle pattern

In this strategy, you’ll learn about the order entry level, stop loss and take profit level.

As a strategy consists of the confluence of three or more technical parameters, we’ll add three technical parameters here in the rectangle pattern strategy to increase the winning probability.

Here are the confluences that we’ll check before looking for entry, stop loss and take profit levels:

  1. The prior trend before the bullish rectangle pattern should be bullish. It represents a trend continuation chart pattern.
  2. Breakout of upper resistance zone of rectangle pattern should happen with a big bullish candlestick. It means the price will break the resistance zone with full potential.
  3. After the breakout, wait for the price to retrace to the 38 Fibonacci level of the previous wave.

These three confluences will give high probability trade setups in the market.

Buy entry

Open a buy order when the price retraces to the 38 Fibonacci level after the resistance zone breakout.

Stoploss

Stop loss should be placed below the low of the bullish rectangle pattern.

Take profit level

Take profit level is the distance between the support and resistance of rectangle pattern in pips. Now project that distance above the resistance zone of the bullish rectangle pattern.

This is the simple day trading strategy for the rectangle pattern.

Conclusion

Trading the trend continuation pattern will always give high probability results because the smart money is trading with the big institutions and market makers. If a retail trader trades against the market makers, he will lose his whole account balance.

Another essential factor in increasing the winning ratio of a trading strategy is confidence in technical tools. It would be best always to consider adding confluences to make a perfect trading strategy.

Make sure to backtest the rectangle pattern at least 100 times to master it.

BUMP AND RUN PATTERN

By IBS ACADEMY

Definition

Bump and Run is a market pattern consisting of two phases determining the price trend reversal. It is a rare chart pattern, and traders use it in stocks, indices, and forex trading.

Thomas Bulkowski invented the Bump and Run pattern. He examined the market structure and made a chart pattern using price action. Retail traders widely use it to forecast the long-term trend analysis of the market.

At the end of this article, I’ll explain a simple trading strategy to trade this chart pattern effectively.

Bump and Run pattern

How to identify Bump and Run Pattern?

To find this chart pattern you should understand the two phases of the market

  • Bump Phase
  • Run Phase

Bump phase

The bump phase price will make a bullish or bearish trend depending on the primary trend. A sudden bump in the price pattern will come

A bump is simply an impulsive wave at the end of the trend.

Before Bump, there was always a trend either bullish or bearish. After the trend, a Bump will form.

How to identify Bump on the chart?

The first step is to draw a trend line based on the previous trend (higher highs and higher lows). According to Bulkowski, the trendline should have a 30-to-45-degree angle based on the logarithm scale on the price chart. This angle shows the strength of the trend.

Tip: Small-angle represents weak price trend while large-angle represents strong price trend.

There must be two to three waves before the Bump to identify a valid pattern on the chart. Look at the image below for a better understanding.

After drawing a trendline on the previous slow trend, you should look for the upcoming Bump in price. During the Bump, the price will move with a steeper trend, moving away from the trendline. Like a false price movement. You can also draw a minor trendline on the bump to confirm the trendline breakout.

The bump wave should be greater in size than the previous two to three waves.

angle of trendlines

How to identify Run on the chart?

After the formation of the Bump, the Run is the second phase of this pattern. Price will break the minor trendline of Bump, and then the Run phase will start. A major trend reversal happens in the market, and the price will move in the opposite direction in an impulsive wave. Then it will also break the major trendline, and another impulsive wave will also form.

Bump and Run phase

Types of Bump Pattern

This chart pattern is further categorized into two types based on the direction of a trend reversal

  • Bullish Bump & Run
  • Bearish Bump & Run

2 Key Market Phases In Bump And Run Pattern

Bullish Bump & Run

It represents the bullish trend reversal. The Bump will show a bearish price trend. After the trend line breakout, a bullish trend reversal will happen. The Run phase will be in the bullish direction.

Bearish Bump & Run

It indicates the bearish price trend reversal. In this type, the Bump will show a prior bullish trend. After the trendline breakout, a bearish trend reversal will happen. The Run phase will be in the bearish direction.

What do the Bump and Run pattern tell traders?

This chart pattern shows the activity of traders behind the candlestick chart. If you read the price, you will be able to understand it.

Let’s assume the prior trend to the Bump formation is bullish. Price is forming bullish waves. It means buyers are stronger than sellers. When a Bump forms, it shows that price has moved larger numbers within a short time interval. Retail traders are not able to move the market like this. So, the Bump move is caused by big traders and institutions.

It shows that big traders have a price level in their mind that they want to break before a trend reversal. The straightforward rule is that big traders eliminate the retail traders before a trend reversal.

In this case, Bump is the way big traders eliminate retail traders, and then a big trend reversal happens.

Tip: Price will break a significant key level before moving in the opposite direction.

How to trade Bump and Run chart pattern?

To trade this pattern, there are two simple ways.

  • You should open an order in the first method just after a minor trendline breakout.
  • In the second method, you should open an order after the breakout of the major trendline breakout.

The second method offers a meager risk-reward ratio, so I recommend you opt for the second method. It is risky, but it will also provide a high risk-reward.

trading Bump and Run pattern

The Bottom Line

Price reading is the priority for a price action trader, and the Bump Run pattern is the perfect example. It is a high probability trade setup.

Some traders add confluence of volume with the Bump wave, but I will recommend you skip volume in the case of forex. Because in forex, tick volume is used.

ASCENDING BROADENING WEDGE

By IBS ACADEMY

ascending broadening wedge

Definition

Ascending Broadening Wedge is a bearish trend reversal chart pattern consisting of expanding wave with two trendlines in an upward direction.

The upper trendline acts as the resistance line and the lower trendline act as the support line. This chart pattern shows a bearish signal with a high winning rate. That’s why traders widely use ascending broadening wedge pattern.

ascending broadening wedge pattern

It is the opposite pattern of descending broadening wedge pattern.

How to identify ascending broadening wedge pattern?

Wedge is a structure that has one thin and one thick end. As the name suggests, it expands with time from the narrow end to the wide end.

  1. To identify this pattern on the chart, follow the following steps:
  2. Find the wave’s starting point, and the wave should make higher highs and higher lows.
  3. Each upcoming wave should be greater in size than the previous wave. It will make a broadening wedge-like structure.
  4. Draw two trendlines meeting the swing high and swing low points.
  5. There must be at least three waves within ascending broadening wedge pattern.

ascending broadening wedge

It would be best to keep in mind that the trend before forming an ascending broadening wedge pattern should be bullish because it should form at the top of the chart for better results.

Pro Tip: The relative strength index indicator will also show the bearish divergence during ascending broadening wedge pattern formation. So, it is a plus point in forecasting the price trend reversal.

What does ascending broadening wedge pattern tell traders?

The structure of this chart pattern shows that price is slowly moving in a bullish direction and breaking the key levels created by sellers. The expansion of the wave indicates that the momentum is increasing in the market with time. And soon the market will take a big decision.

example of ascending wedge

Let me explain you in detail

When price makes higher highs and higher lows, it shows the break of key levels. On each higher high, the price will break a resistance level. And sellers are weak, and they cannot compete with the buyers. But the number of sellers is increasing with time.

On each wave’s formation, the wave size increases, showing that buyers require more effort to push the price in the bullish direction. After 3 to 5 attempts, buyers will fail to keep the bullish momentum, and many sellers will enter the market. This will cause a bearish trend reversal.

While analyzing the market, you should try to read the market structure. In this way, you will filter the good patterns from the crowd.

How to identify trendline breakout?

Price will break the lower trendline. Many false breakouts can happen, but you should always show patience.

There is a simple and effective method to filter false breakouts of the trendline.

The breakout of trendline should always happen with a big bearish candlestick. A big candlestick means a candle with more than 70% body to wick ratio. Big body and small shadows. It shows the enormous momentum within less time at the support line.

ascending broadening wedge breakout

After the breakout, you can also wait for the price to retrace in a bullish direction because this will confirm that either there is a true trendline breakout or a false trendline breakout.

Ascending Broadening Wedge Pattern | High Winning Ratio

Conclusion

The origin of ascending broadening wedge pattern acts as the target level for sellers. Due to high accuracy, this chart pattern is widely used by retail traders to forecast the market. Many traders use the RSI indicator with this chart pattern.

The best way to trade chart patterns is by using the confluence of the most basic technical analysis tools like supply & demand zones, Fibonacci tool, and key levels.

Before trading on a live account, make sure to backtest ascending broadening wedge pattern.